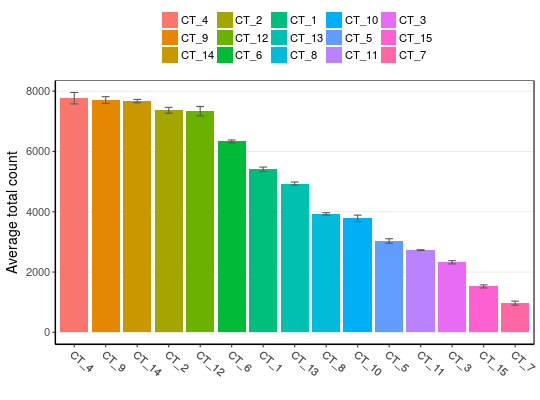
Plots Total Count Per Cell Type
Generate a barplot
plotCellTotals(eset, cellType, sampleID)
Arguments
- eset
- a matrix or
ExpressionSetobject. - cellType
- vector or name of phenotypic variable that contains the mapping of each column (i.e. each cell) to a cell type.
- sampleID
- vector or name of phenotypic variable that contains the mapping of each column (i.e. each cell) to a biological sample.
Value
a ggplot object with ggplot2::geom_bar.
Examples
#> [1] "cellType" "sampleID" "group"# plot counts plotCellTotals(x, 'cellType', 'sampleID')